7 key concepts for dimensional engineering

Dive into dimensional engineering and learn how it drives product quality through precison measurements.
What is dimensional engineering?
Dimensional engineering combines different aspects from the design, manufacturing, and metrology fields.
I often define dimensional engineering as the study of how part level imperfections affect a product at the assembly level. We all understand that our parts will be somewhat imperfect when they are manufactured (nothing is perfect), but how much imperfection can our design absorb and still be considered satisfactory? To answer this question and describe the Dimensional Engineering process we’ll cover 7 key concepts.
Dimensional engineering requirements
A dimensional engineering requirements are a specific necessity of the end product that must be measured and fall within a certain range. It answers the question “what is the line between satisfactory and unsatisfactory for our design?” It could be something aesthetic such as the gap/flush between two pieces of bodywork on a car. It could also be something functional such as ensuring the charging port on a phone lines up with a hole in the housing. In a perfect world, a gap designed to be 6mm will always be 6mm; in reality this won’t be the case. Accompanying any dimensional requirement will also be a range of acceptable values for that dimension after assembly.
In the example below, the gap between the motor (grey part) and the stator (blue part) is designed to be 0.4mm, but the product will be considered satisfactory if the gap falls between 0mm and 0.6mm: 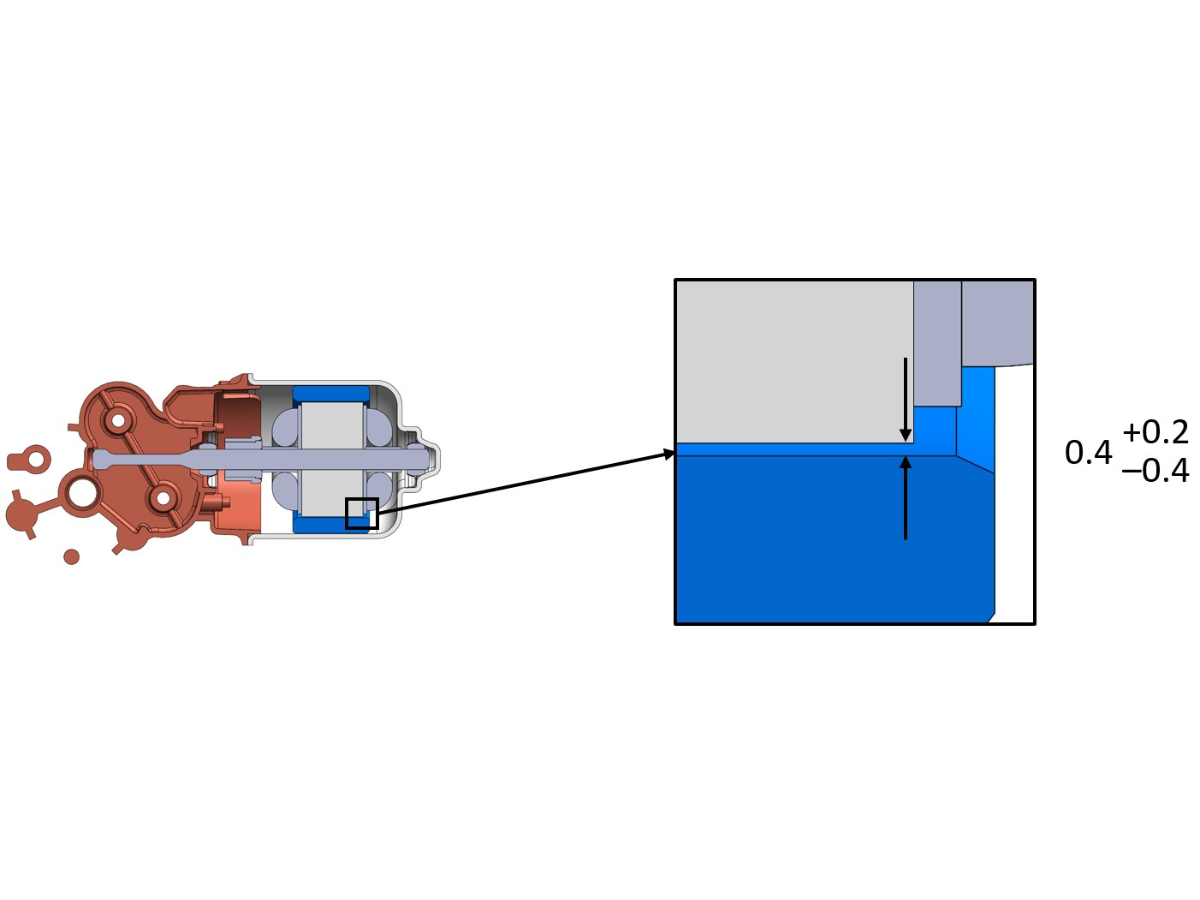 The limits of the requirement in this case are functional: if the gap decreases to less than 0mm then we will have scraping between the motor and the stator and if the gap increases to greater than 0.6mm then we have a performance problem, the motor is too far from the stator for ideal motor performance.
Part locators (Datums)
Additional critical features of a part are its locating features. Often the locating features of a part are referred to as Datums, specifically in industries with a long history of Dimensional Engineering such as automotive or aerospace. Datums are a part of GD&T (mentioned later).
How a part is located within an assembly can also inform us of critical features on other parts. It is generally best practice to spread out the locators across a part as much as possible as this will yield more stability and consistency in the end product. If you think about locating a side panel to the frame of a car, this concept is simple to grasp: if all of the locators for the side panel are biased toward the front of the panel, then we will likely have great repeatability at the front of our assembly… but very poor repeatability at the rear. If the locators are more spread out, then we will have better repeatability across the entire part.
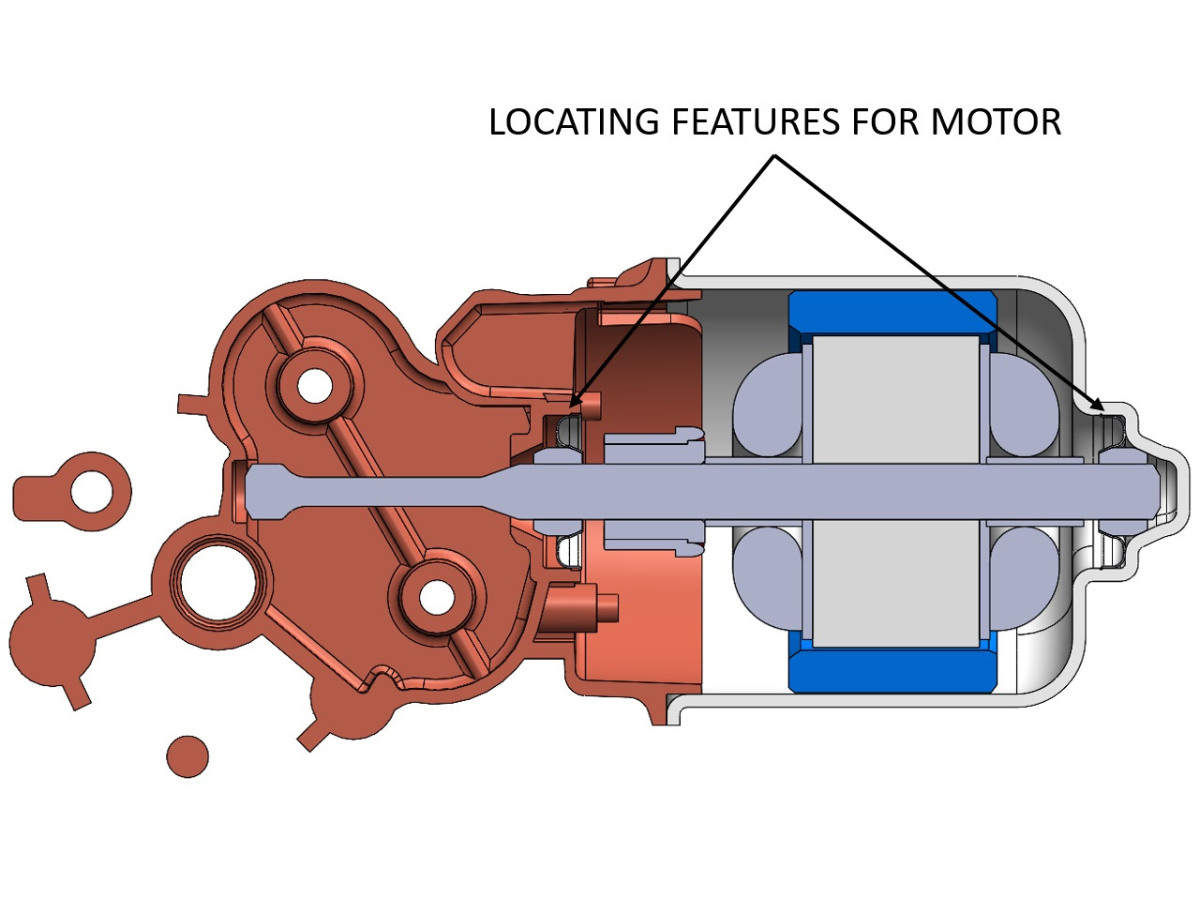
In the example from earlier, the motor is located to the base (red part) and cover (grey part) through two diametrical collars. This means that any variation in the position of either of those collars will result in the motor’s location changing and our critical gap to the stator changing.
 Part level variation
To determine how much our dimensional requirements will vary, we need to understand how much variation the critical features of our parts will have. The amount of variation a specific feature will have can be communicated in several different ways. Three commons ways are:
- Geometric Dimensioning & Tolerancing (GD&T)
Often found on engineering drawings, GD&T is a language using select symbols, numbers, and letters to communicate to the reader how much a specific feature can vary and what that allowable variation is relative to. An example of a Feature Control Frame (the “sentence” of the GD&T language) is shown below.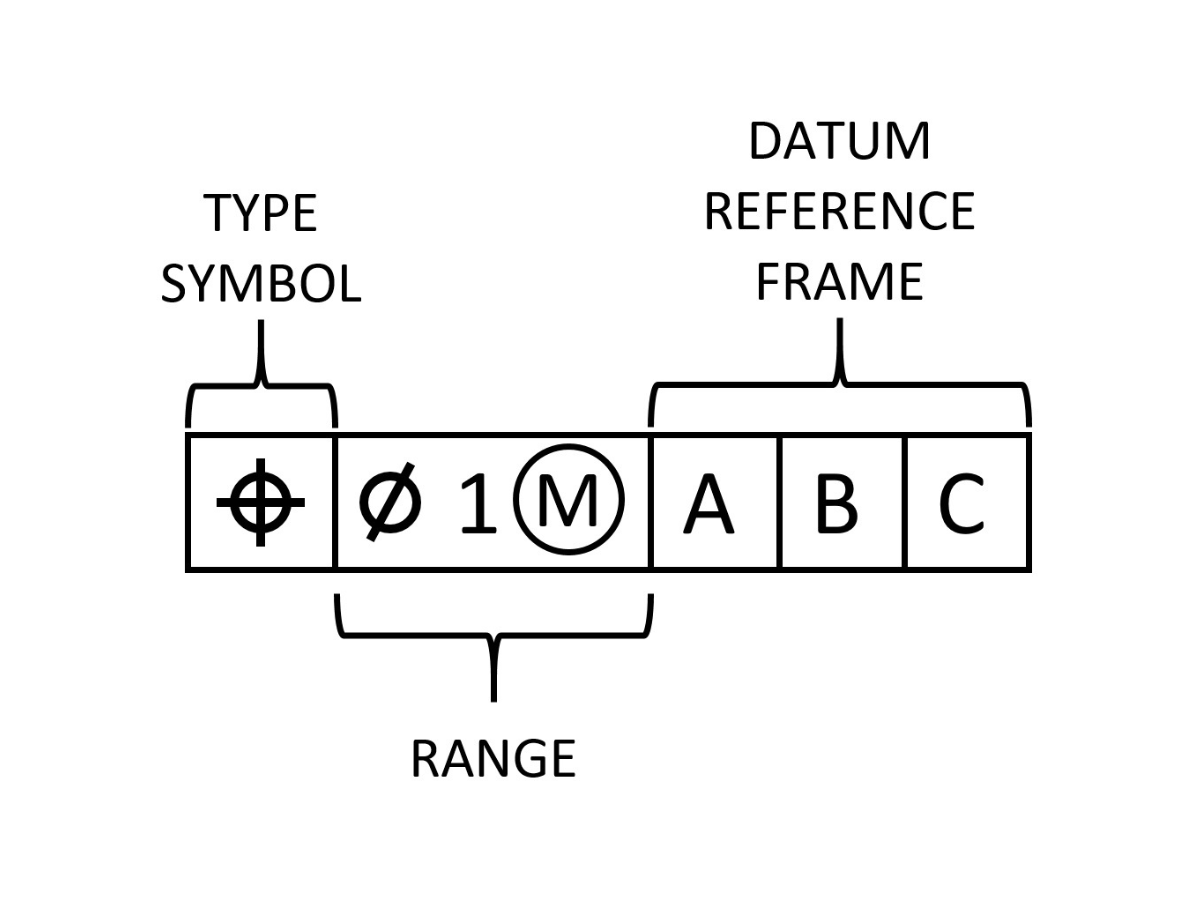
- Linear Dimensioning
The precursor to GD&T, linear dimensioning is still found on engineering drawings. Linear Dimensions are limited but easy to understand. It is often represented as a design value paired with an acceptable range. A few examples are shown below.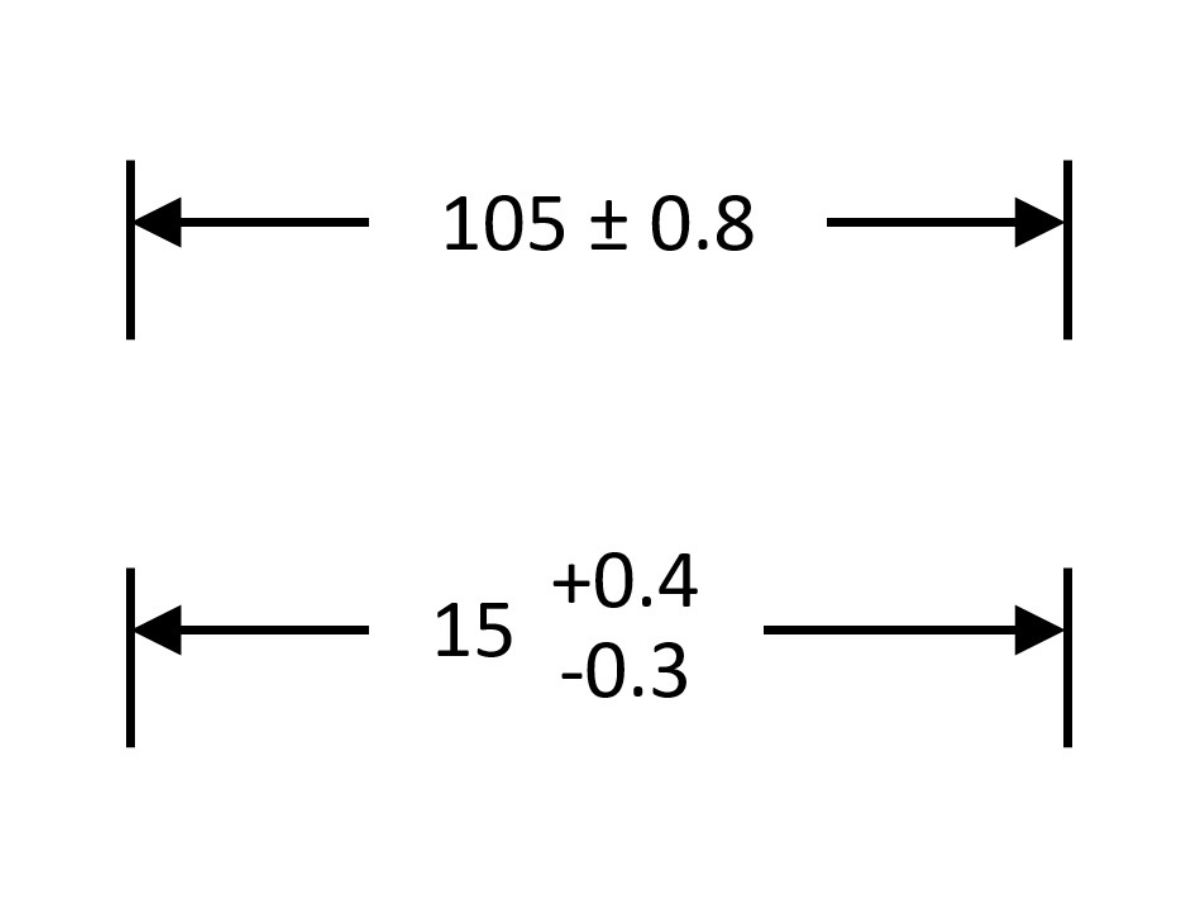
- Historical Knowledge
Before an engineering drawing has been prepared, historical knowledge can be used as a tool for a Dimensional Engineer to predict variation for a critical feature. This could be as simple as a number that is pulled from “last year’s design” or a deep understanding of the manufacturing process that is used to create a critical feature.
For the sake of this blog and having an example, we have GD&T on an engineering drawing for the base. In the upper-right view of the drawing there is a GD&T callout informing us of the allowable size and location variation for the inner diameter locating the left collar of the motor in the earlier image. 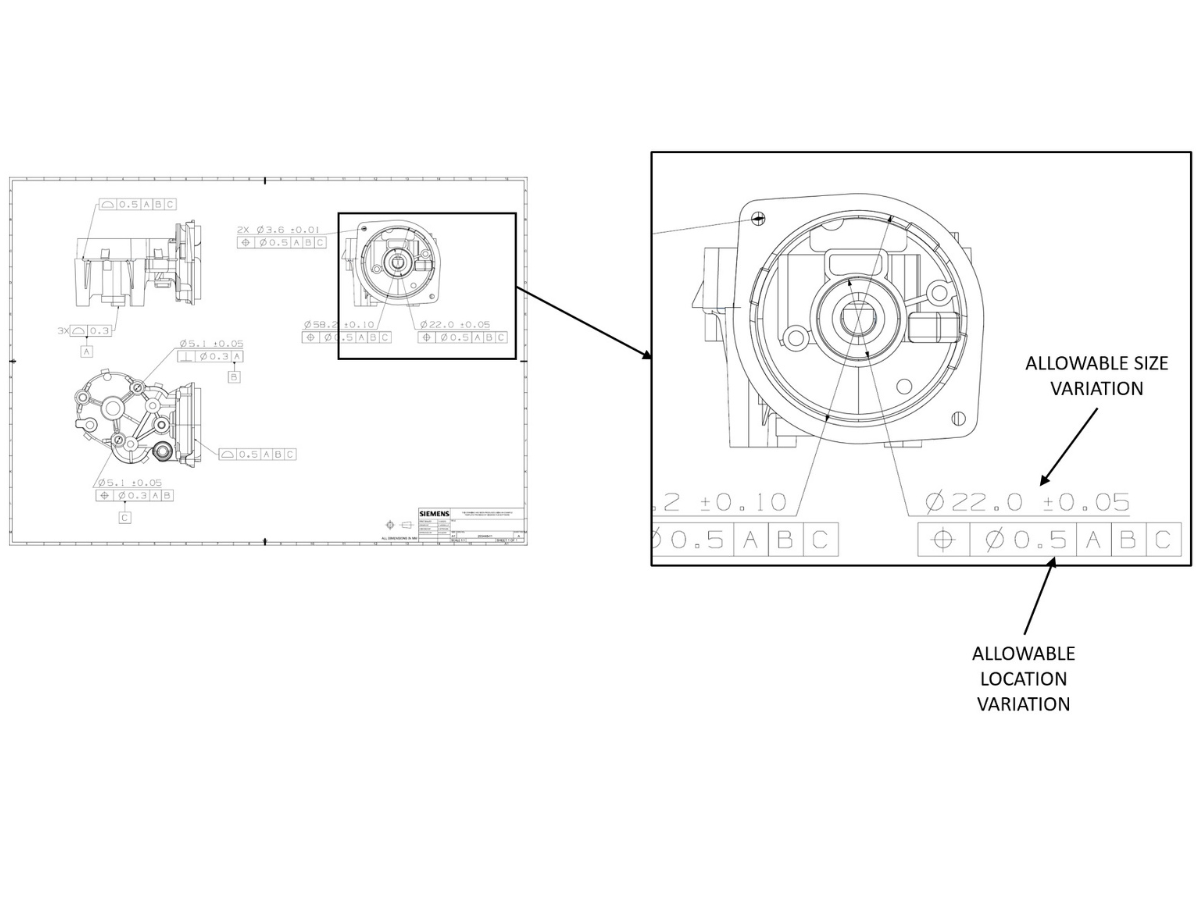

We can use a computer-aided engineering (CAE) tool to visualize how the location variation of the inner diameter of the base influences the final location of the motor, which will grow or shrink the critical gap we identified earlier.
The gap opening and closing in the above image is only a result of a single feature on the base varying from its perfect design location. When variation is simulated on all critical features in the model, we get what can be called a virtual build. Once again, a CAE software can help us visualize this:
You can see that our gap is influenced by several different aspects of our design. And while we’ve focused on a single dimensional requirement, we need to consider any and all we may have in the model. While this model is quite small it could still have dozens of requirements we’d want to consider. It is common for there to be hundreds or thousands of requirements on an entire vehicle or airplane.
Analyzing our design’s performance
Combining the key concepts above (and baking in a few assumptions) we can gain some confidence about how our design will perform even before a single part has been manufactured. Using either a CAE tool for in-depth studies or a simple Excel spreadsheet for what are commonly called Tolerance Stack-Ups, we can get some baseline results.
In our motor and stator example, our baseline results for the gap measure are shown below.
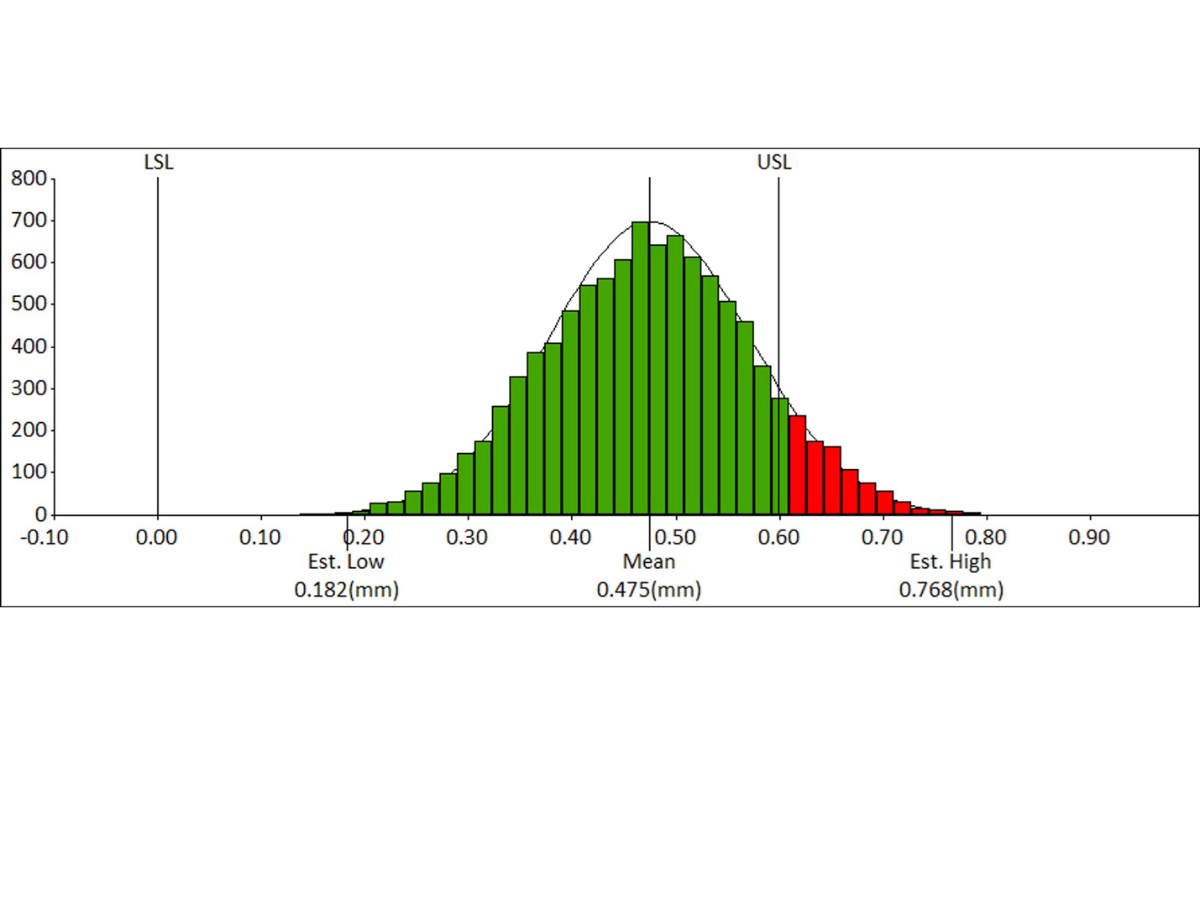 You can see several green bars (the virtual builds that were in between our design limits) and a few red bars (the virtual builds that were outside of our design limits). In this case, about 10% of our builds were outside our upper limit of 0.6mm. This is not an ideal situation and certainly is a design that requires some additional attention.
Suggesting design changes
It’s important to remember that Dimensional Engineering is only a part of the entire product design/engineering process. Any suggestions we make may not work for other aspects of the design process. For that reason, it can be helpful to offer up a number of different solutions. A few examples are as follows.
- Tighten a tolerance
The first suggestion you will likely hear in any design room experiencing dimensional management problems is: “Well which tolerance should we tighten?” and while this idea is coming from the right place it also comes with flaws. Tightening a tolerance will likely require a new process for manufacturing that part (or at least feature of a part) and that comes with a cost. This is a viable option, just one we should frame correctly and always look at other alternatives. - Change the locating features
While sometimes challenging (especially later in the design process), it can sometimes be useful to consider what features are being used as locators. Could we possibly choose better ones? - Use a Build Fixture
Build fixtures are objectively quite expensive, but they also are very effective. Build fixtures can be a great tool to reduce variation at our key dimensions and drive variation to less important areas. - Make a Design Change
This isn’t always a realistic option, but sometimes it isn’t the amount of variation we want to reduce, but our “starting point” for how that variation is affecting us. In the motor-stator example, our distribution is biased towards the upper limit of our allowable zone. If it is possible to tighten up the design gap by either reducing the ID of the stator or increasing the OD of the magnet then the results will potentially improve. In the image below I have reduced the design gap from 0.4mm to 0.25mm, sliding the distribution over to be centered within my limits.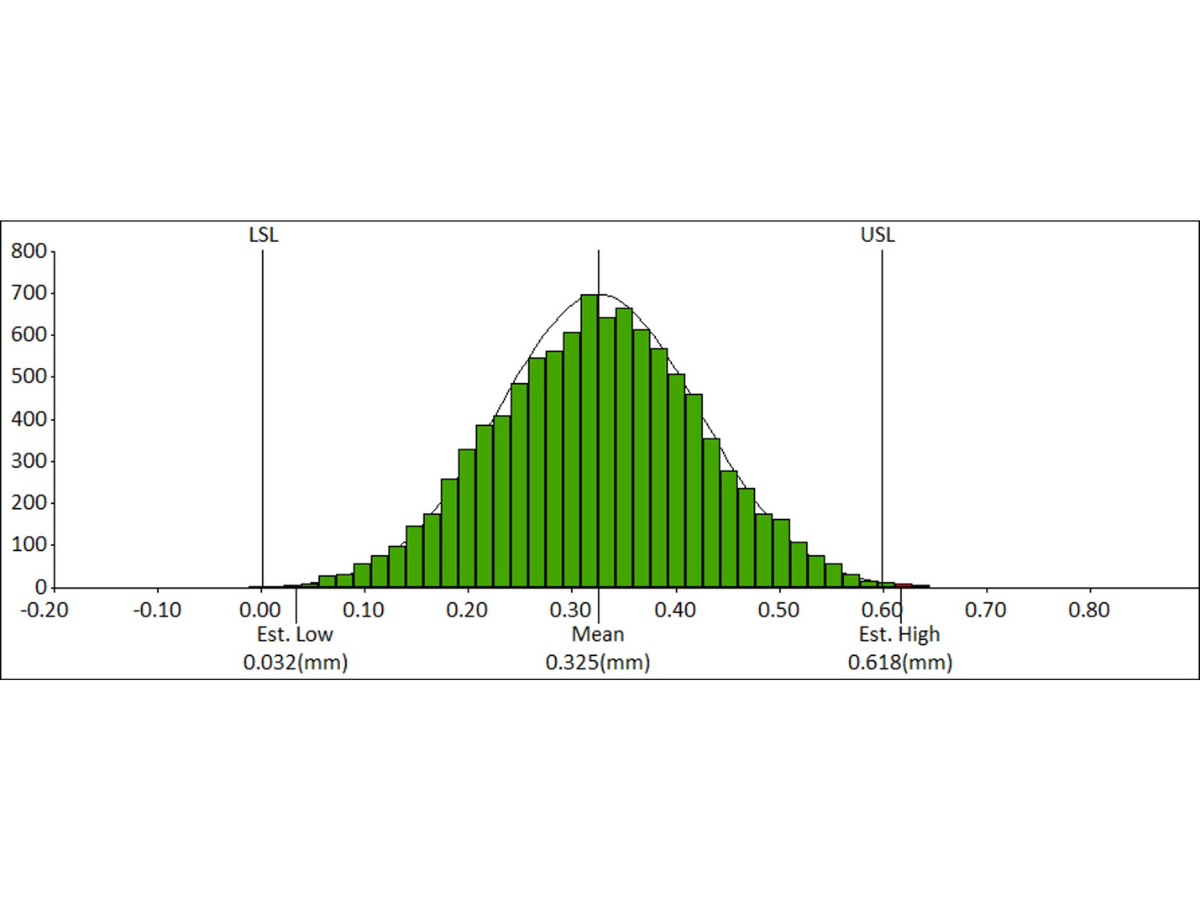
Assumptions vs. measured data (Closing the Loop)
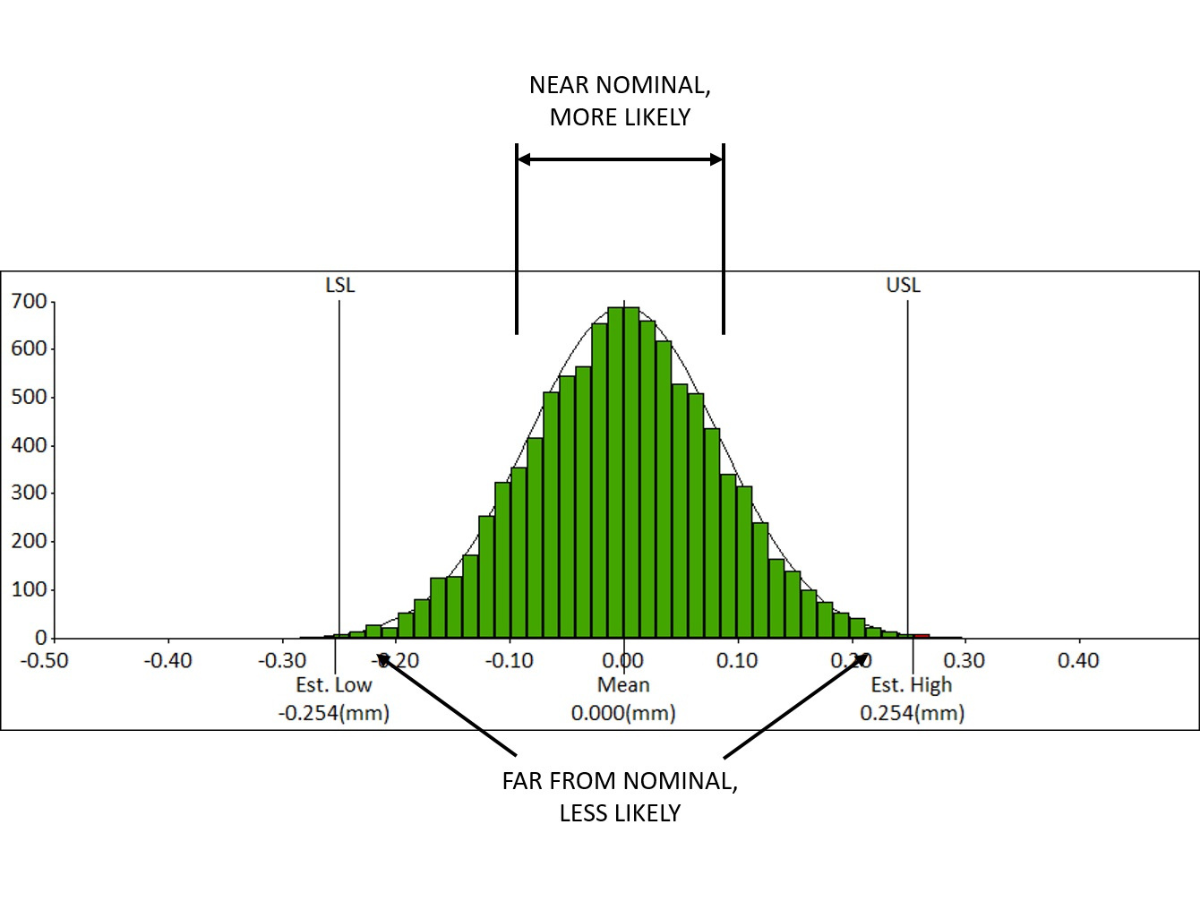
I mentioned before that we needed assumptions to run our initial analysis. The standard assumption in dimensional engineering (if we don’t have any measured data) is that we are manufacturing with a Cp/Cpk equal to 1. This is a quality engineering term that simply means the process for a given feature yields a ±3σ normal distribution. In simple terms… if we think of the critical feature on the base from earlier, it is just as likely to be up as it is down with a bias towards the design value rather than the limits of the allowable range.
 This is a fine assumption before we have actual measured data, but the investigation should be revisited to see how well our assumptions hold up. As an example, let’s say that the feature we’ve focused on from the base is coming in with a tight distribution, but it is always biased in a specific direction away from where the design position is.
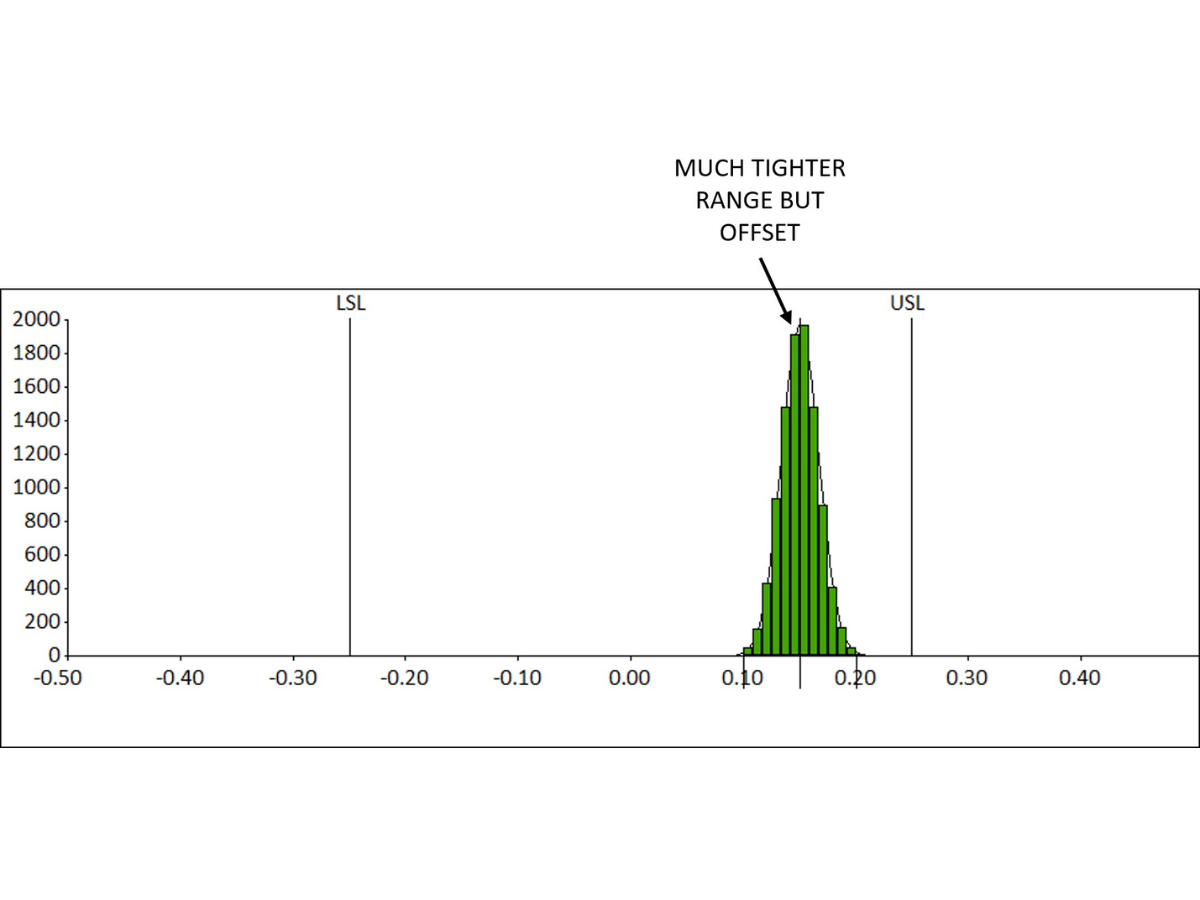
This is something we may want to address with the manufacturer, it looks like the process may be slipping! But for now, we must deal with the problem. We can adjust our analysis to see how this affects the motor-stator gap.
In this case our distribution has crept closer to the upper boundary of acceptability, but we are still looking pretty good. This is a step that is often forgotten in any dimensional analysis as gathering and analyzing the actual measured data can be time consuming or challenging, but it is critical to “close the loop” on our analysis using the measured data.
Future iterations of your design
One thing that is great about Dimensional Engineering is that our studies can continue informing design choices! It may have been too late to incorporate some of the lessons we learned on this year’s design but maybe next year or the following year we can change a locator, incorporate a fixture, loosen an arbitrarily tight tolerance, etc.
The field of Dimensional Engineering goes far deeper than simply these seven concepts, but they can serve as an introduction. The fields of manufacturing and metrology are large aspects of the Dimensional Engineering process, but speaking on those could be an entire post. I hope this has been helpful and inspiring for you to think about how you and your company have handled dimensional management in the past and how you can think about it differently in the future.